A better way to read the market
Three weeks of the US hospitality conversation, ranked by reach.
American hospitality is one of the loudest earned conversations on social video, and it is almost entirely unpaid. 9,975 videos, 1.31 billion views, a 6.84% engagement rate, and 99.6% created by people the brands never hired. Two forces shape the window. The FIFA World Cup is pulling travel demand into US host cities. And an affordability conversation is running neck and neck with luxury. Marriott leads brand share, but Disney and Airbnb win the room on engagement. Underneath it all, 508 videos name a hotel brand out loud with nothing written, 82 million views that text-based listening never sees.
The 82M-view blind spot
508 videos say a hotel brand aloud with no matching caption or hashtag, 81.9M views invisible to Meltwater, Brandwatch, and Dig.ai.
The World Cup is the story
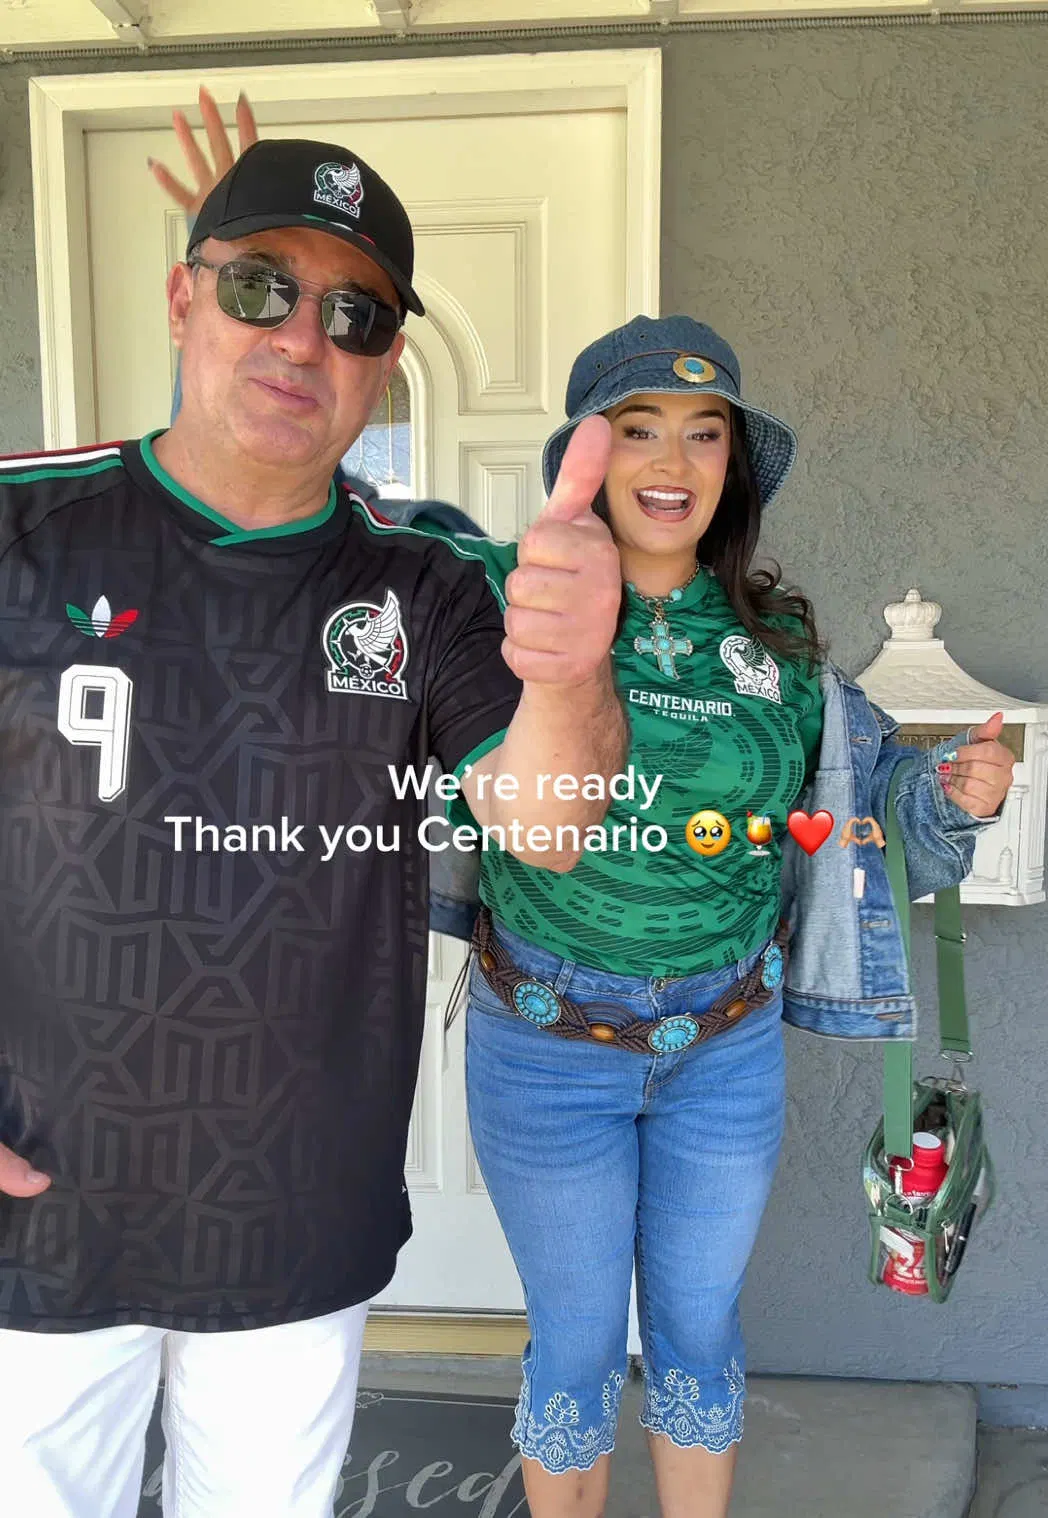
The 2026 FIFA World Cup, co-hosted across US cities this window, drove 661 videos and 115.5M views. #worldcup was a top-3 hashtag overall.
Affordability rivals luxury
Budget and deals content reached 1,084 videos against 1,006 for luxury, and out-engaged it (6.10% vs 5.34%).
 Watch ↗
 Watch ↗
 Watch ↗
 Watch ↗
 Watch ↗
 Watch ↗
Volume peaks mid-June then tapers, while engagement climbs the other way (6.17% to 7.62%) as the World Cup narrows the field to higher-intent travel content. Publish dates confirm the export skews to the most recent, highest-reach weeks rather than the full quarter named in the file.
What America is booking
The cultural moment driving demand, the topics creators make, and where value beats luxury.
The World Cup is a hospitality demand engine
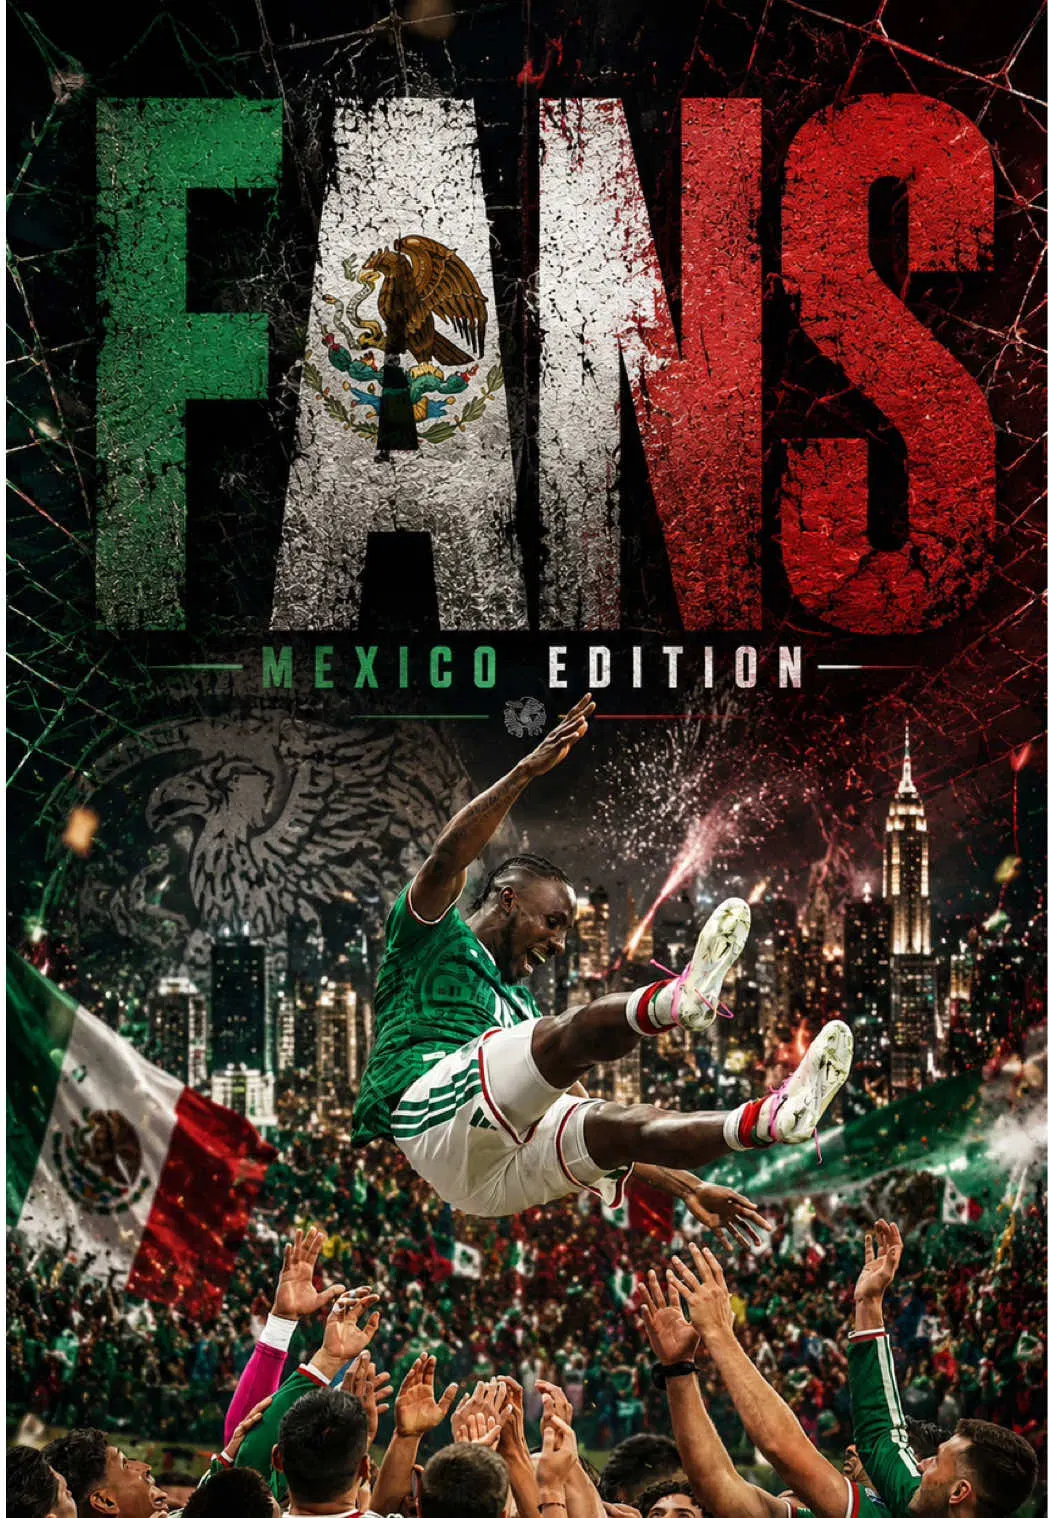
The 2026 FIFA World Cup runs across US host cities inside this window, and it shows up everywhere in the hotel conversation: #worldcup (239 uses), #fifaworldcup (100), #worldcup2026 (72), plus #usa and #soccer in the top tags. Travelers documenting host-city stays are creating hotel content at scale. Host-city properties have a live, time-boxed window to be in the frame.
Watch ↗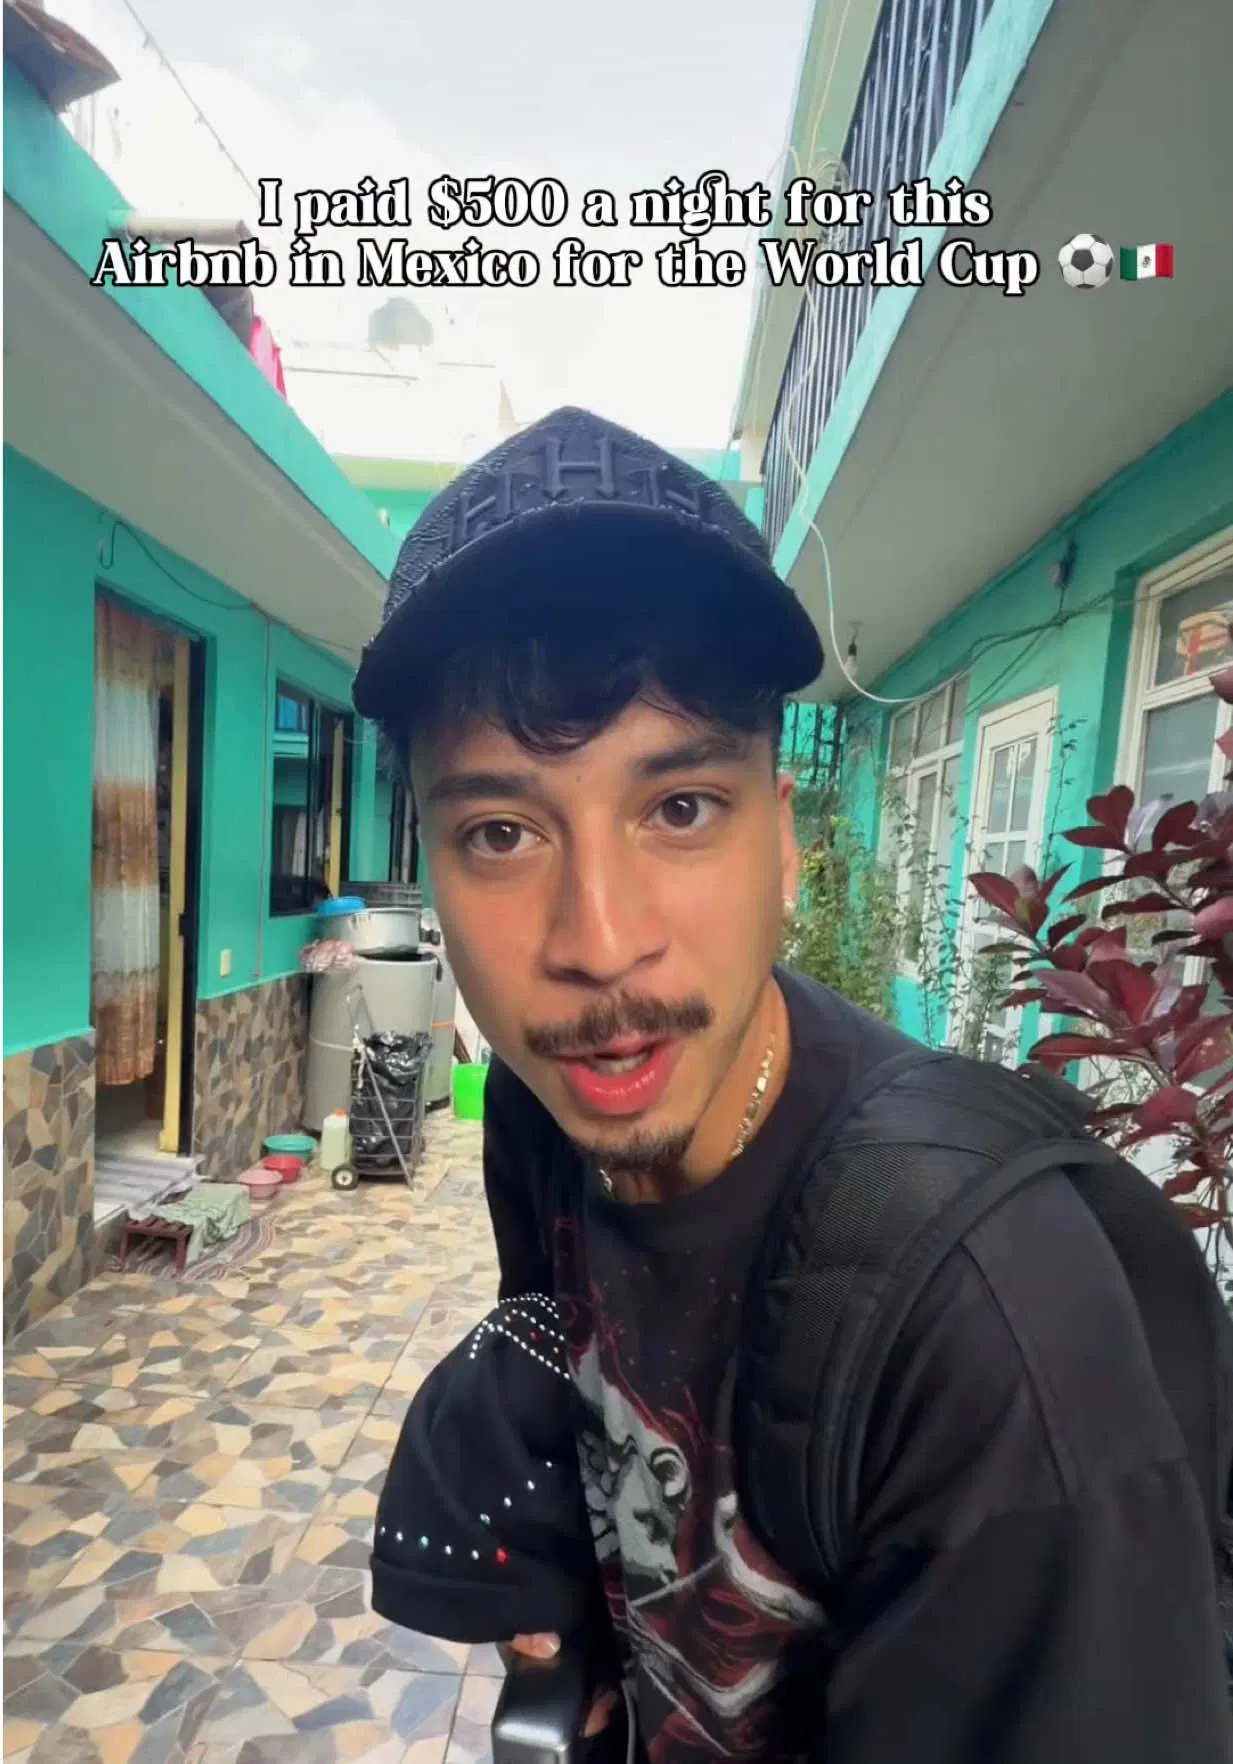 Watch ↗
 Watch ↗
 Watch ↗
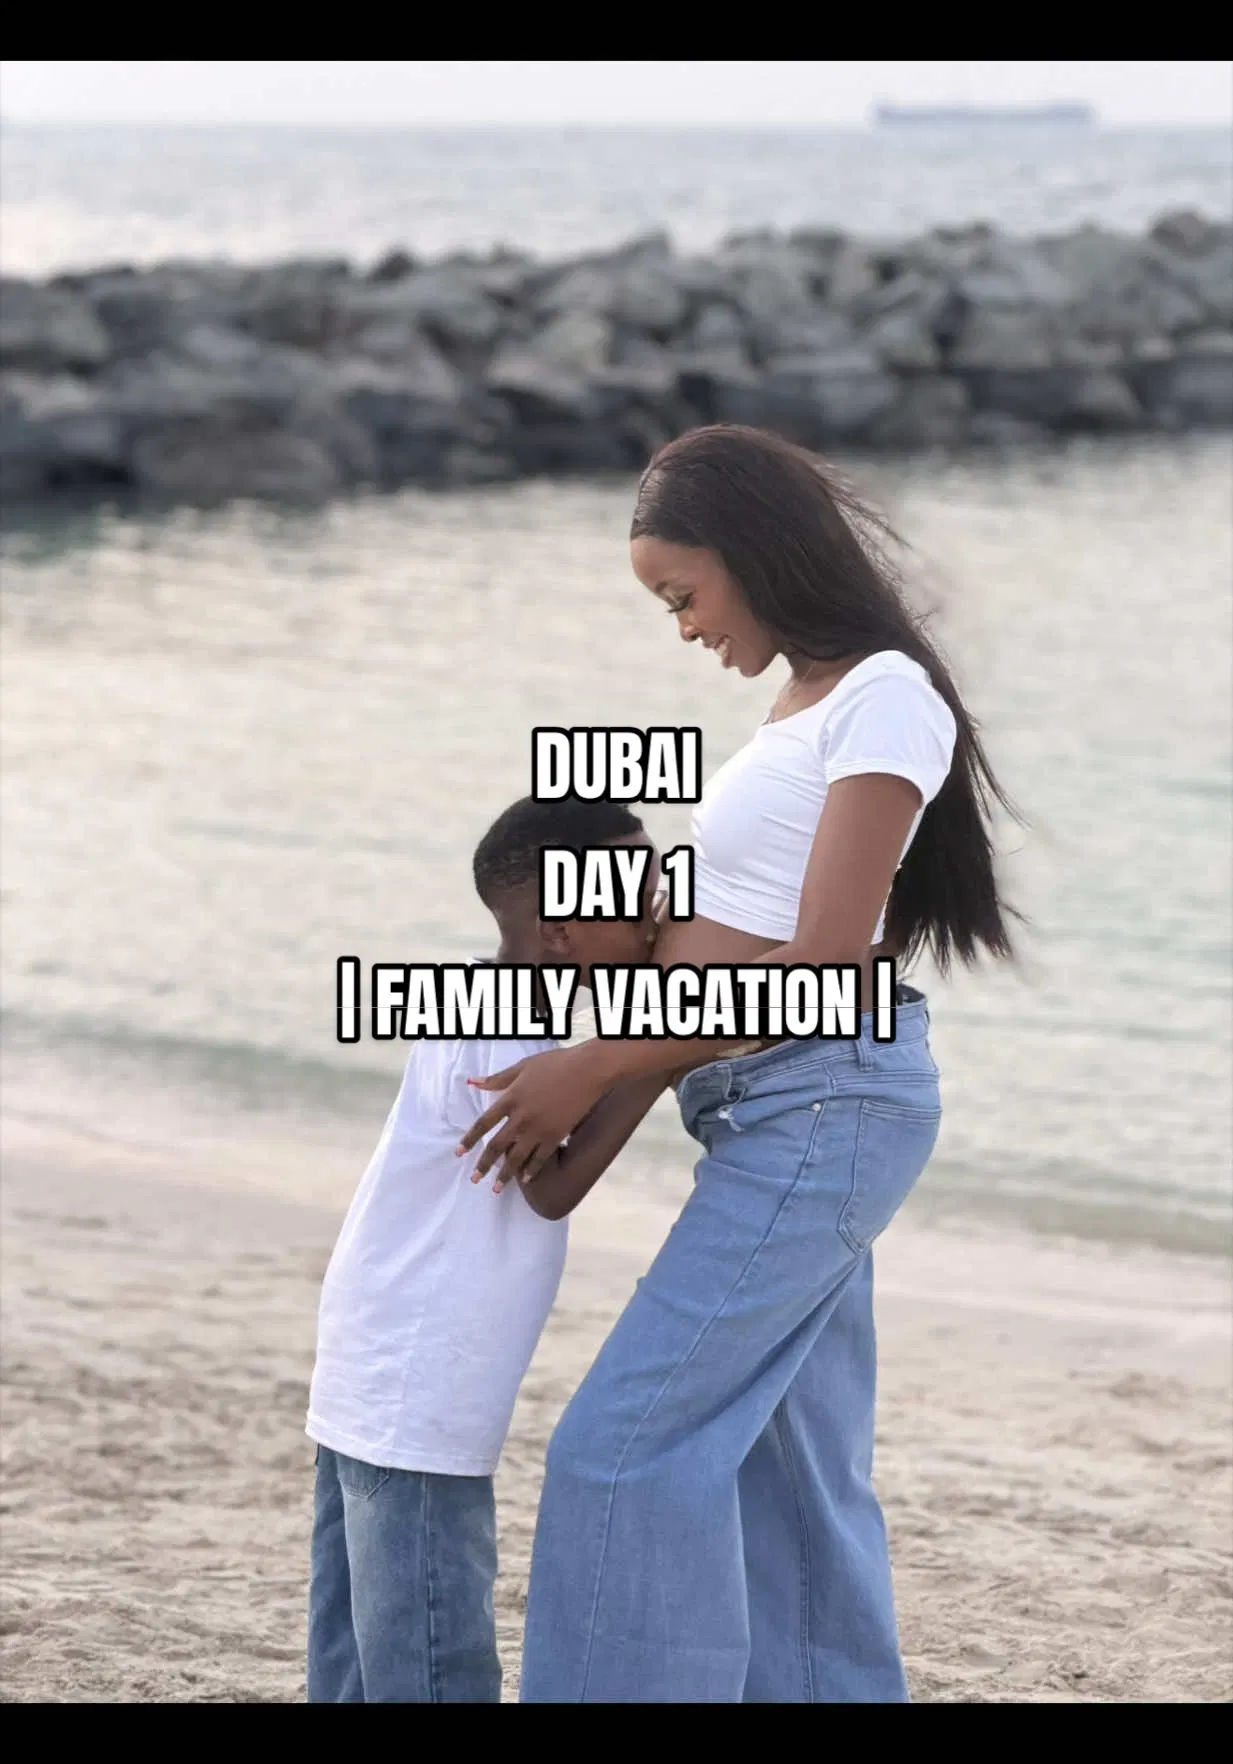
Deals content is the co-headliner with luxury, and it engages harder. Resort (1,889 videos) is the umbrella; family travel (716 videos, 118M views) and loyalty points (328 videos, 86M views) are the high-reach sub-conversations worth owning.
Who owns the conversation
Share of voice, engagement quality, and the hidden spoken layer, brand by brand.
Marriott leads on raw presence, but engagement tells a different story: Disney resorts (6.96%) and Airbnb (6.61%) beat every traditional chain, while Hyatt (4.23%) and Wynn (4.79%) trail. Volume and resonance are not the same win.
Views where the brand is said aloud but never written. Invisible to text tools.
Hilton converts fewer mentions into more reach than Marriott, ~440K views per video vs 347K.

The people carrying the brand
6,832 creators produced this conversation. Here is who moves it and who to partner with.
Mid-tier (100K–1M) is the engine at 4,820 videos. Accounts under 5K are not indexed, so nano is effectively absent.
The unverified crowd engages 48% harder than verified accounts. Authenticity, not a blue check, drives reaction.
| Creator | Vids | Views | ER | Tier |
|---|---|---|---|---|
| @mrsdowjones | 2 | 39.8M | 0.02% | MACRO |
| @kristinjohnss | 1 | 17.9M | 0.05% | MID |
| @joshlilj | 1 | 13.3M | 9.17% | MACRO |
| @travelwithlivii | 12 | 12.8M | 3.73% | MID |
| @n3onnn | 1 | 11.3M | 10.11% | MID |
| @matthewbeem | 1 | 9.8M | 0.38% | MID |
| @christian.grossi | 12 | 9.2M | 8.74% | MACRO |
| @emilyannwillcox | 2 | 9.1M | 0.05% | MID |
| @therock | 2 | 9.0M | 6.77% | MACRO |
| @cboothang | 1 | 8.4M | 14.41% | MID |
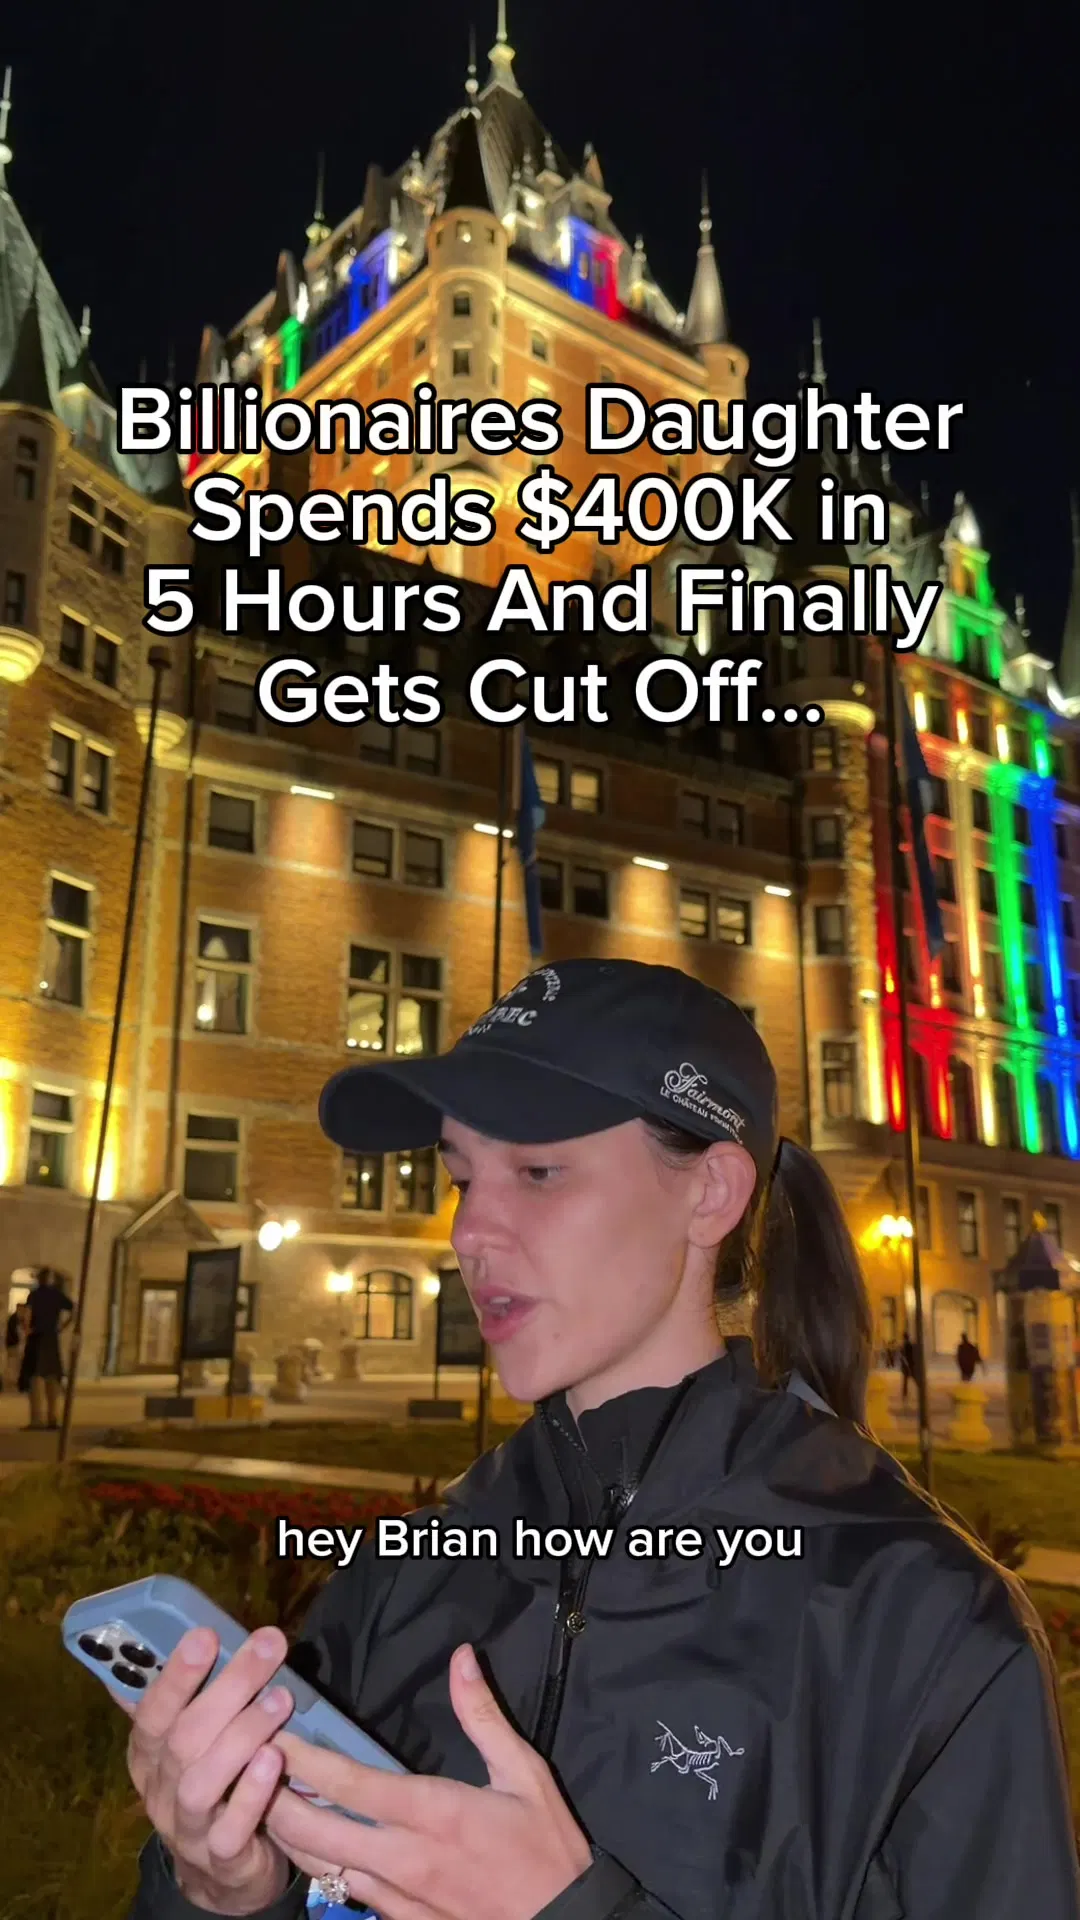
Reach is not resonance: several of the biggest-view videos post near-zero ER (mrsdowjones, kristinjohnss), one-off virals that grazed hospitality. joshlilj and n3onnn pair mass reach with 9%+ engagement, the profile worth chasing.
Watch ↗Watch ↗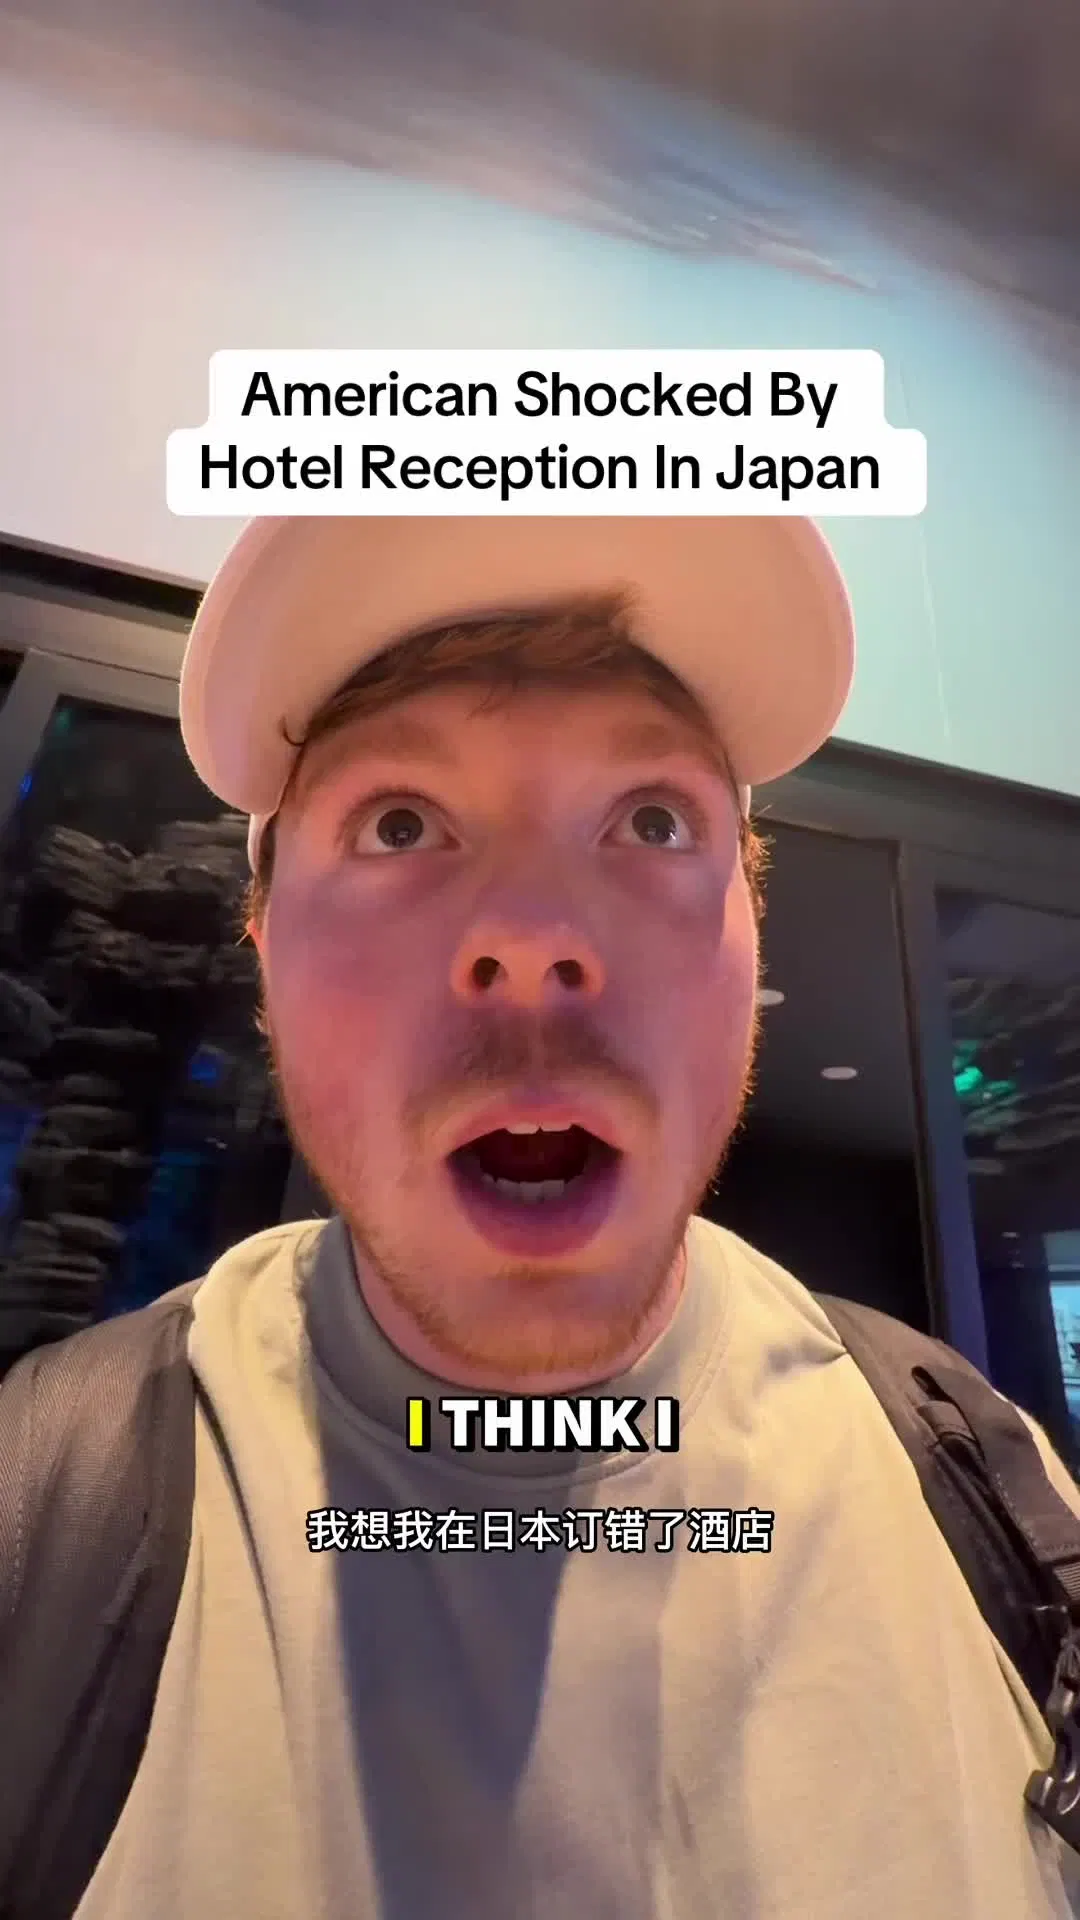 Watch ↗Watch ↗
 Watch ↗
| Creator | Vids | Views | ER |
|---|---|---|---|
| @itskellmartin | 2 | 2.1M | 25.94% |
| @ashleytheebarroness | 2 | 472K | 24.75% |
| @awilkyy | 6 | 317K | 23.86% |
| @aji_anje | 2 | 371K | 23.22% |
| @prettipara | 2 | 2.5M | 22.51% |
| @laurenkkim0 | 2 | 418K | 22.42% |
| @iconistaedits | 3 | 264K | 21.68% |
| @alex_falcone | 2 | 411K | 21.64% |
| @artseysmart | 2 | 274K | 19.38% |
| @akoko_val | 4 | 1.7M | 19.21% |
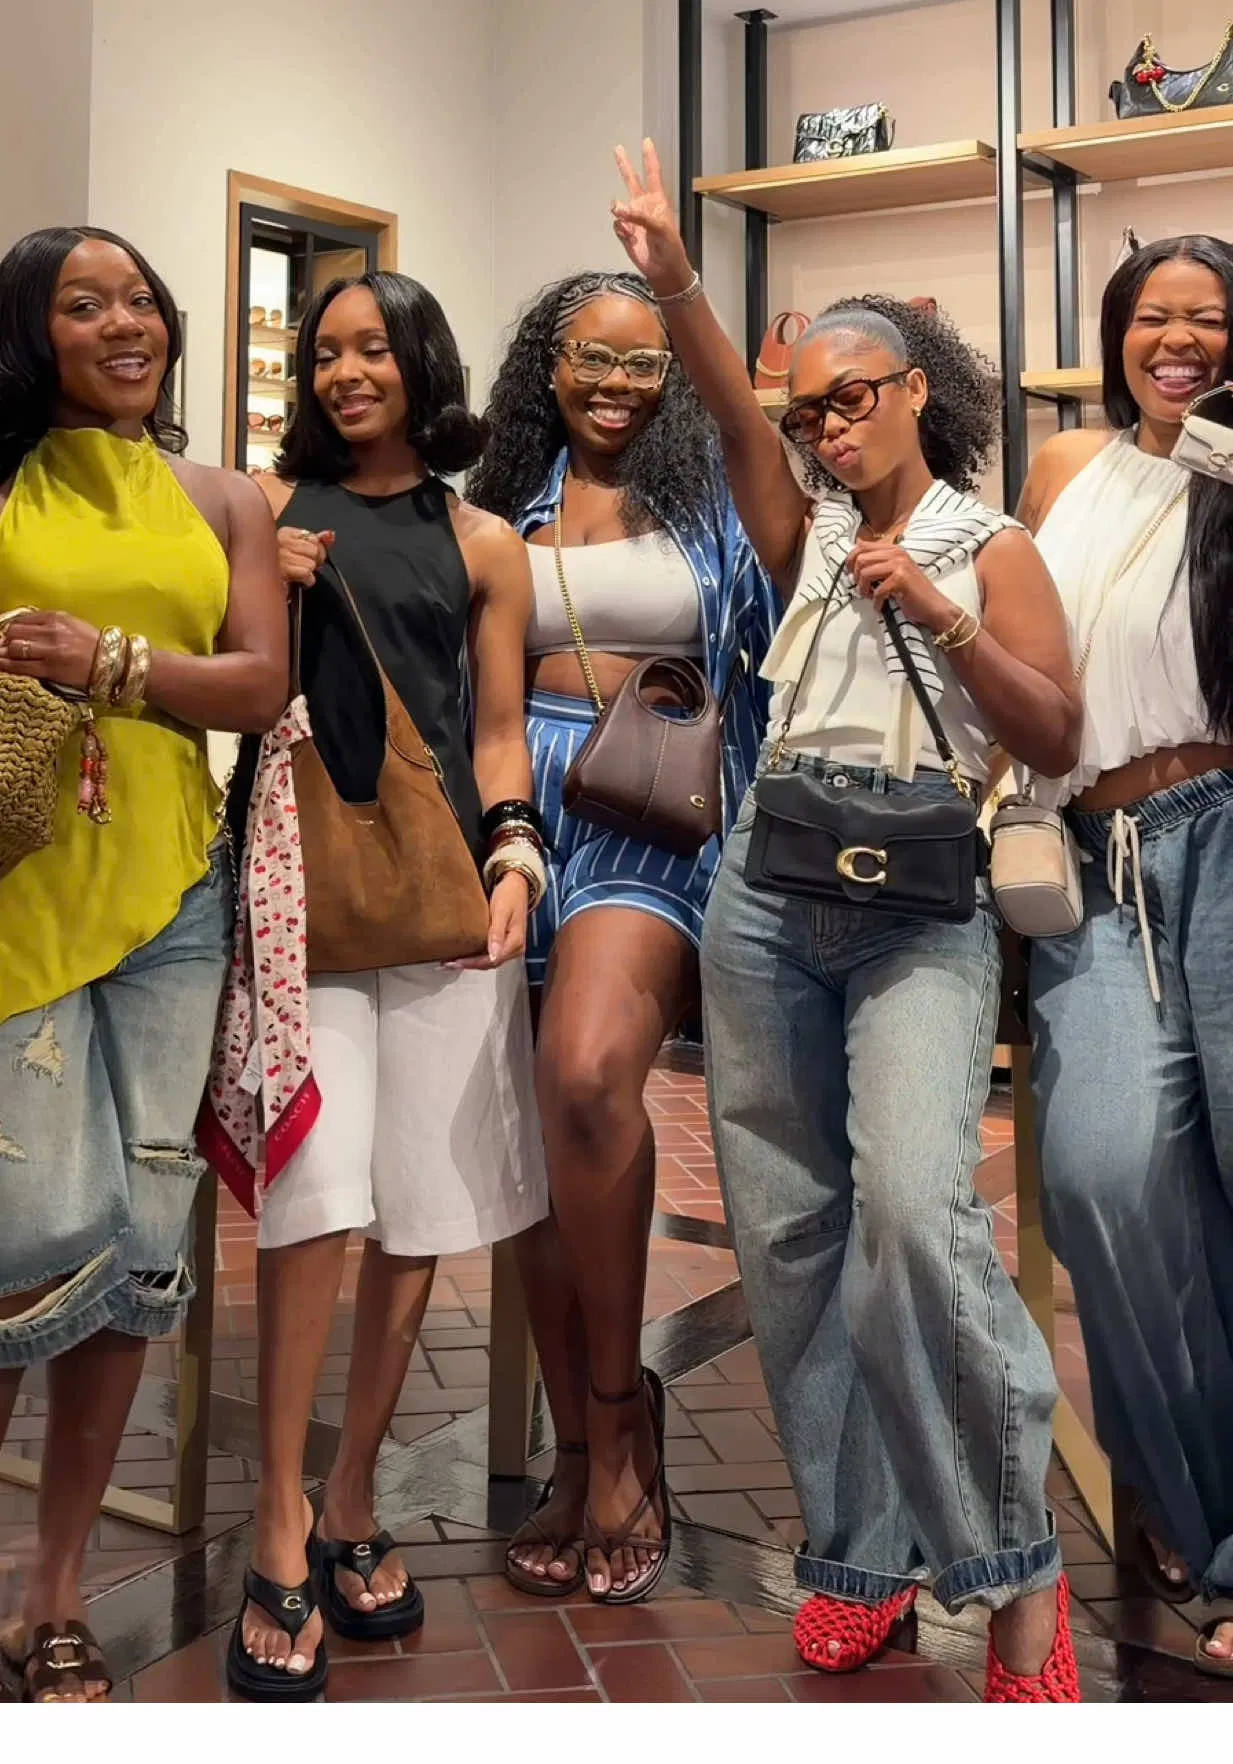
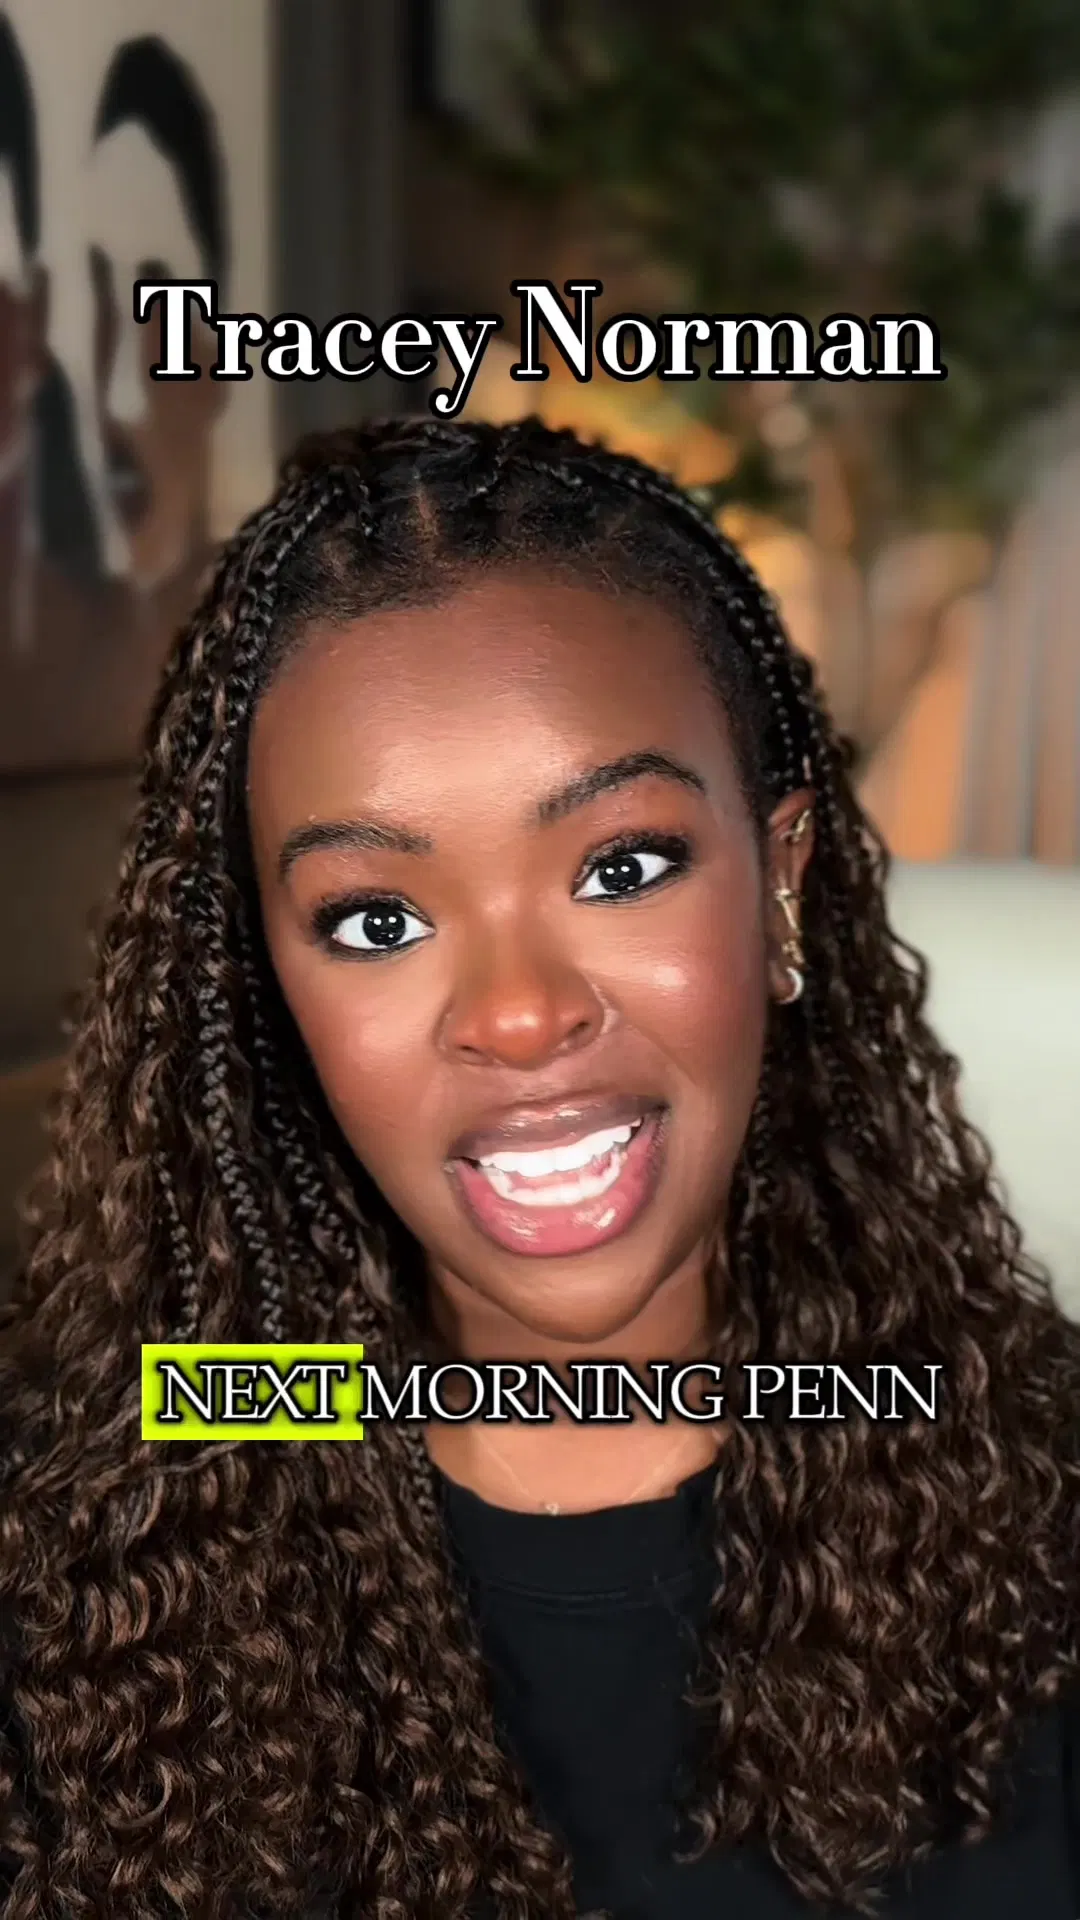
Two-plus hospitality videos, 200K+ views, 19–26% engagement, almost all unverified mid and micro creators. @prettipara (46.5K followers, 22.5% ER) and @itskellmartin (25.9% ER) punch far above their follower weight.
Watch ↗ Watch ↗
 Watch ↗
 Watch ↗Watch ↗
 Watch ↗
What actually performs
Length, platform, paid vs organic, and the safety of the environment.
A barbell: sub-15s hooks (9.71%) and 90s+ depth (7.30%) win. The 30–60s middle is the dead zone (5.33%). Go very short or go long, skip the mush.
TikTok is the engagement machine (7.71% ER); Instagram delivers more views per post (161K vs 119K) at a third of the engagement. Different jobs, different edits.
Only 1.5% of videos carry a paid tag, and they engage at nearly half the organic rate. The audience rewards content that does not feel bought.
Of videos with clear sentiment, positive outweighs negative ~12 to 1 (5,782 vs 469). Positive content drew 742.1M views against 56.8M negative. A clean, low-risk environment for activation.
Seven moves, each tied to the data
Decisions, not observations.
Ride the World Cup while it is live
Host-city properties have a closing window. Amplify traveler content in real time, seed creators covering host cities, and attach loyalty offers to match-day stays. The demand signal is already there and will fade with the final whistle.
661 videos · 115.5M views · #worldcup top-3 hashtagBuild an affordability pillar, not just luxury
Value content matches luxury for airtime and beats it on engagement. Program deal-led, points-led, and hack-led content alongside the aspirational reel. The audience asks how to afford the stay as loudly as they admire it.
Budget 1,084 @ 6.1% vs Luxury 1,006 @ 5.34%Copy the Disney and Airbnb engagement playbook
Experiential, family, and tour formats out-engage every traditional chain. Shift the content mix toward walk-throughs, family moments, and behind-the-key access over glossy exteriors.
Disney 6.96% · Airbnb 6.61% vs Marriott 5.24% · Hyatt 4.23%Recover the shadow-reach layer
508 videos and 82M views name brands in audio only. Text tools miss all of it. Use Oriane spoken-word detection to credit this reach and quantify true share of voice competitors cannot see.
508 spoken-only videos · 81.9M hidden viewsWeight partnerships to mid-tier and unverified
The crowd engages 48% harder than verified accounts, and mid-tier drives the volume. Build the roster from the hidden-gems list, not the follower leaderboard.
Non-verified 7.28% vs verified 4.93% · mid-tier 6.74%Produce a barbell of lengths
Sub-15s hooks and 90s+ depth win; the 30–60s middle underperforms. Commission both ends and stop defaulting to the half-minute clip.
0–15s 9.71% · 90s+ 7.30% vs 30–60s 5.33%Split the platform brief
TikTok for engagement, Instagram for reach. Cut and caption for each rather than cross-posting one master edit.
TikTok 7.71% ER · IG 161K views/vid